 This is from Dr. Vincent Granville, Co-Founder, Big Data Scientist, DSC Network.
Dr. Vincent Granville is a visionary data scientist with 15 years of big data, predictive modeling, digital and business analytics experience. Vincent is widely recognized as the leading expert in scoring technology, fraud detection and web traffic optimization and growth. Over the last ten years, he has worked in real-time credit card fraud detection with Visa, advertising mix optimization with CNET, change point detection with Microsoft, online user experience with Wells Fargo, search intelligence with InfoSpace, automated bidding with eBay, click fraud detection with major search engines, ad networks and large advertising clients.
Benchmarking a Metric
When you compare two metrics A and B (for instance, two different ways to define a robust correlation), which tests should you carry out to assess whether A is better than B? Of course, it depends on the context – sometimes A will be better, sometimes B, depending on the context.
 But once the context is specified, what about carrying out predictive modeling (even on old data) to determine which metric to use? For instance, if the context is high frequency trading, where you use millions of lag-1 and lag-2 cross-correlations to identify profitable signals (e.g., when Google is up today, then Facebook is down tomorrow – this is a made up example), the solution seems pretty simple. On historical data and using cross-validation, did A or B perform better, in terms of return? In order to make a sound decision about choosing A or B, you must be sure that your trading strategies are market-neutral and based on enough data; otherwise, what seems to be working best today might fail tomorrow.
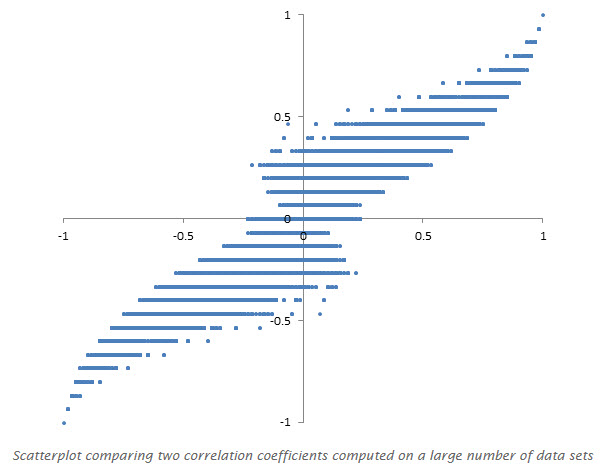
Another option is to plot a scattergram representing the two metrics computed on a large number of data sets. In your scattergram, each point represents a data set; the x coordinate represents the A metric, the y coordinate represents the B metric. Look at points that are outlier, outside the diagonal. For these outliers, have an expert assess whether A or B is better. For the other, non-outlier points, A and B agree.

One thought on “DataViz Tip: How to Benchmark a Metric”